


Overview
iDealing.com offers an interactive online chart application, which allows you to view historic daily charts as well as live streaming intra-day charts.
Viewing a Chart
|
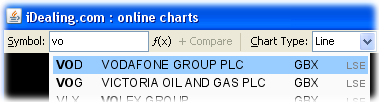
To view the chart of an instrument:
The chart will begin loading and soon you should see the chart for the selected instrument. |
 |
You can select different chart options to control the chart viewing aspect. See below for more information.
Advanced Features
Explore the advanced features that our charts have to offer...
Chart Types
You can customise the way you view the chart by selecting different chart options...
Use the drop-down menu to select view a particular type of chart.
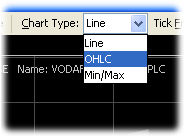
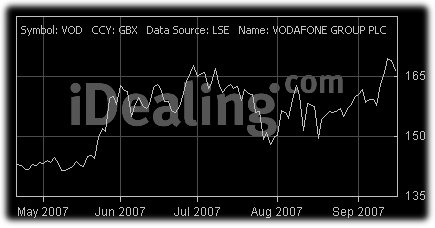
Line ChartsYou can choose to view different chart types by selecting from the chart type drop-down menu. |
 |
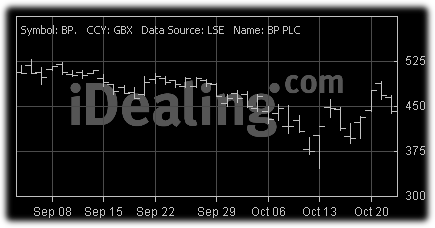 |
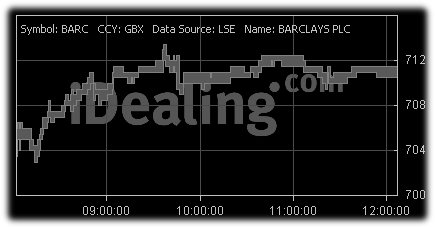
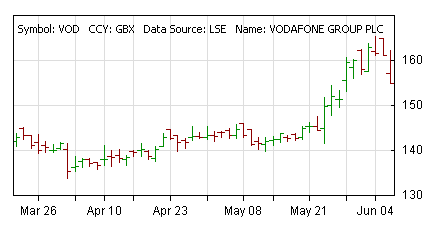
OHLC ChartsThe OHLC Charts illustrates the price movement, shows the opening, highest, lowest and the closing price for each time frame. |
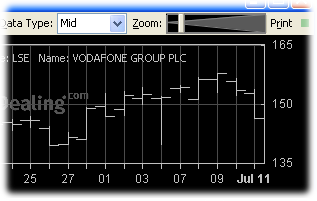
Min/Max ChartsThe Min/Max Charts, are great for illustrating the historical behaviour of the bid/offer spread. |
 |
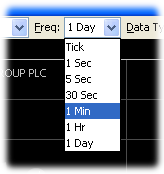 |
FrequencyVary the time frame of which the chart is viewed by selecting the different frequencies from the frequency drop-down menu. For example when you select '1 Min' each OHLC bar will represent a 1 minute period, and each bar will show you the opening, highest, lowest and the closing price for that minute. Select '1 Day' frequency to view daily charts which will show you the daily historic prices. All other intra-day tick frequencies will show you real-time streaming prices. |
Data TypeYou may select from available data types from the data type drop-down menu. Mid (Mid-Price), Bid/Offer, and Trade are examples of data types that may be available for a given security and time frame. |
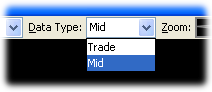 |
Chart Navigation
 |
Zooming and Scrolling
Zoom
Scroll |
CrosshairsCrosshairs will appear when the mouse pointer is over the chart, and the crosshairs follow the mouse cursor. The price level of the horizontal hair is shown in the grey box on the price scale on the right. As you move the mouse cursor across the chart a red track ball follows the vertical hair where it intersects the price plot. The time and price at that position is displayed in the price legend at top of the chart below the chart title. In this example the price is 153.80 at 12 March 2008. To turn on/off crosshairs:
|
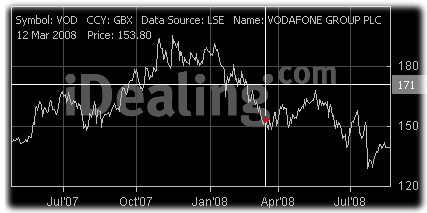 |
Chart Colour
You can define custom colours to the chart and give the chart a different colour scheme.
To change the chart colours:
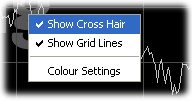
- Right click on any part of the chart. A menu will popup.
- Click the Colour Settings option.
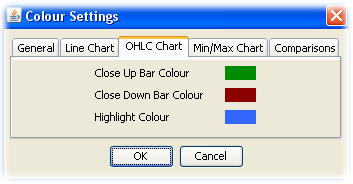
- A Colour Settings window will appear. Select the appropriate tab. The General tab will allow colour setting changes for all chart types.
- There will be a list of colour items you can select for the chart type.
- Click on the colour box to select the item colour you want to change.
- A colour spectrum will appear for you to select a colour.
- Select a colour and click OK.
- Change any other item colours by clicking on their respective colour box
- Once you have finished setting the colours, click OK.
Printing
- Click on the Print button, and a Print window will appear.
- Set all the print options and click the Print or OK button at the bottom of the Print window.